Guest Post – Avoided Emissions: Unlikely Heroes
By: Ian Stannard, ICE Sustainable Finance
ICE’s research on identifying and quantifying potential Avoided Emissions has highlighted how climate opportunities can be found in unlikely sectors and companies outside of the obvious candidates. Our approach, highlighted in a Whitepaper by ICE and EcoFin Investors, aims to help investors not only manage climate risks, but also identify investment opportunities (See Making an Impact: Avoided Emissions, June 2023).
Harnessing this research, we used the ICE Avoided Emissions Module (available on the ICE Climate Transition platform) to examine global diversified portfolios, such as the ICE Global Broad Market Equity Index, to identify climate opportunities.
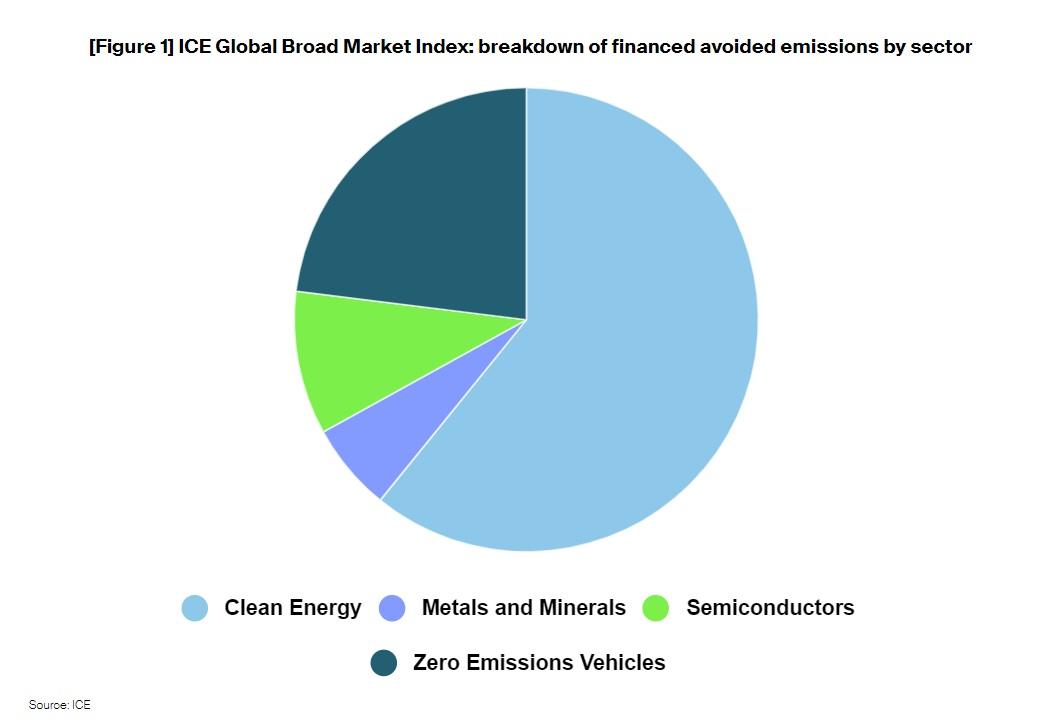
Analyzing companies from across the Semiconductors, Clean Energy, Metal and Minerals, and Zero Emissions Vehicles sectors, we found potential Financed[1] Avoided Emissions weighting heavily towards the Clean Energy sector.

Indeed, within the ICE Global Broad Market Equity Index 60% of potential Financed Avoided Emissions identified are located within the Clean Energy sector (Figure 1). This compares to 23% in the Zero Emissions Vehicles, 10% in Semiconductors and 6% in the Metals and Minerals sectors (Figure 1).
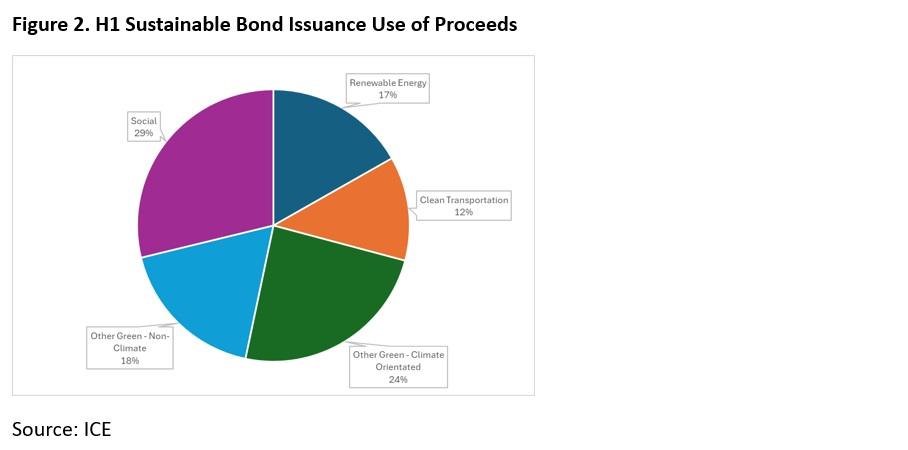
While Clean Energy and Clean Transportation maybe the sectors where potential Avoided Emissions are most likely to be found, and two of the most popular destinations for green investment, the question remains; do these sectors deliver the greatest relative climate “impact”? The Renewable (Clean) Energy sector attracted 16.78% and the Clean Transportation sector 12.38% of Sustainable Bond proceeds in the first half of 2024, according to ICE research (Figure 2).
One way of measuring the potential relative Avoided Emissions impact of a company (or portfolio) is via the Carbon Impact Ratio. This metric shows potential Avoided Emissions as a proportion of carbon emissions to provide a useful method for cross company, sector and portfolio assessment.
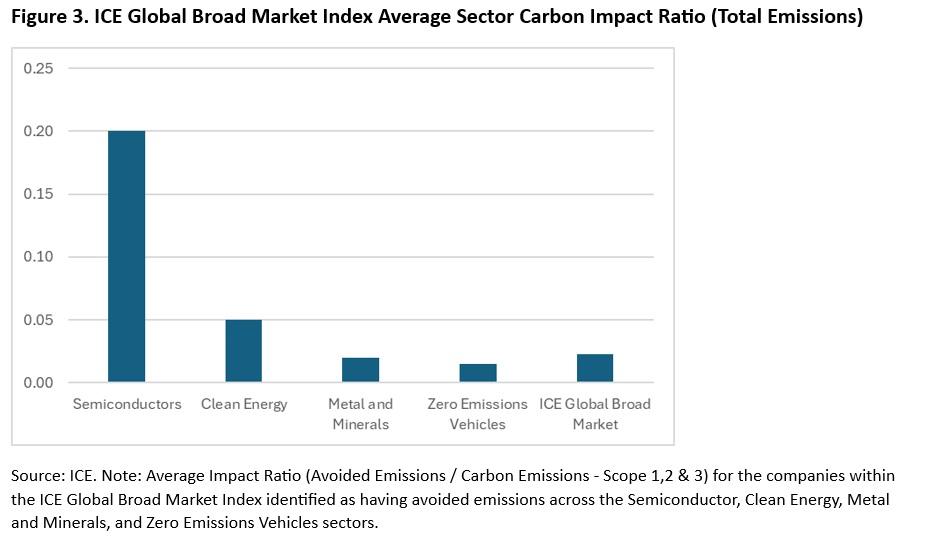
Analysis of the ICE Global Broad Market Equity Index using the Carbon Impact Ratio finds that the Semiconductor sector stands out as having the highest ratio, in both terms of Total Emissions and Emissions Intensity by revenues, while the Metals and Minerals sector has the lowest Cabon Impact Ratio. Figure 3 shows the Carbon Impact Ratio in terms of Total Emissions for the four sectors we examined and the overall ICE Global Broad Market Equity Index).
While the Semiconductor industry has the lowest level of Avoided Emissions of the four sectors examined within the index, these Avoided Emissions represent a larger percentage of average overall emissions in terms of both absolute emissions and emission intensity of the sector. This is a result of the Semiconductor industry having a relatively lower carbon footprint compared to other sectors. Hence, the semiconductor sector has a relatively larger average Carbon Impact ratio.
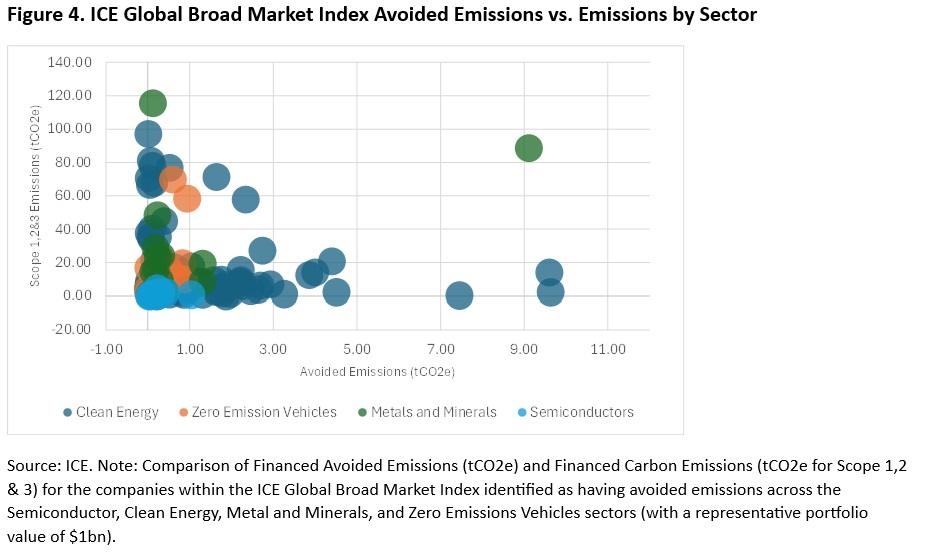
The Semiconductor sector may seem an unlikely sector to be leading the way in Carbon Impact (Figures 4 and 5). So, where exactly do Avoided Emissions reside within this industry?
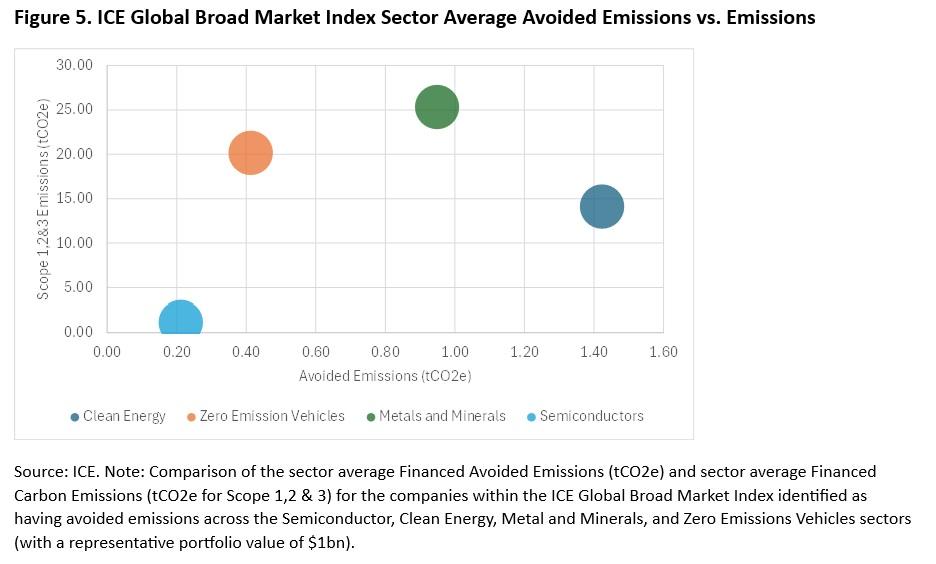
The answer lies in the applications where Semiconductors are used, such as in clean energy solutions (Solar and Wind) and electric vehicles. The methodology used to measure the potential Avoided Emissions from Semiconductors includes quantifying the proportion of a company’s revenue arising from clean energy and electric vehicle segments, as well as assessing LCA-based Avoided Emissions factors for clean energy and electric vehicles, and capital cost-based attribution factors.
The Semiconductor sector is a good example of how Climate Impact can be achieved and realized across the value chain of products and technologies. It highlights how even low Carbon Intensity sectors and industries have an important role in the transition to a lower carbon economy. Begging the question, could Semiconductors be one of the unlikely heroes of climate transition?
[1] A representative portfolio value of $1bn was used for financed avoided emissions calculations. The ICE Global Broad Market Equity Index was selected as a representative portfolio.

